About
During the summer of 2023, we conducted outreach and engagement efforts in southeast Seattle to locate trouble spots of speeding and crossing by community, for Seattle’s Department of Transportation Slow the Flock Down! Campaign .
Slow the Flock Down!
Slow the Flock Down! is a SDOT Vision Zero public safety education campaign to encourage drivers to slow down while driving in the City of Seattle to advance the safety of all people. Launched in July, 2022 in efforts to raise awareness on new safety improvements made based on key areas where data shows the most serious crashes occur. This campaign is set to end in 2023.
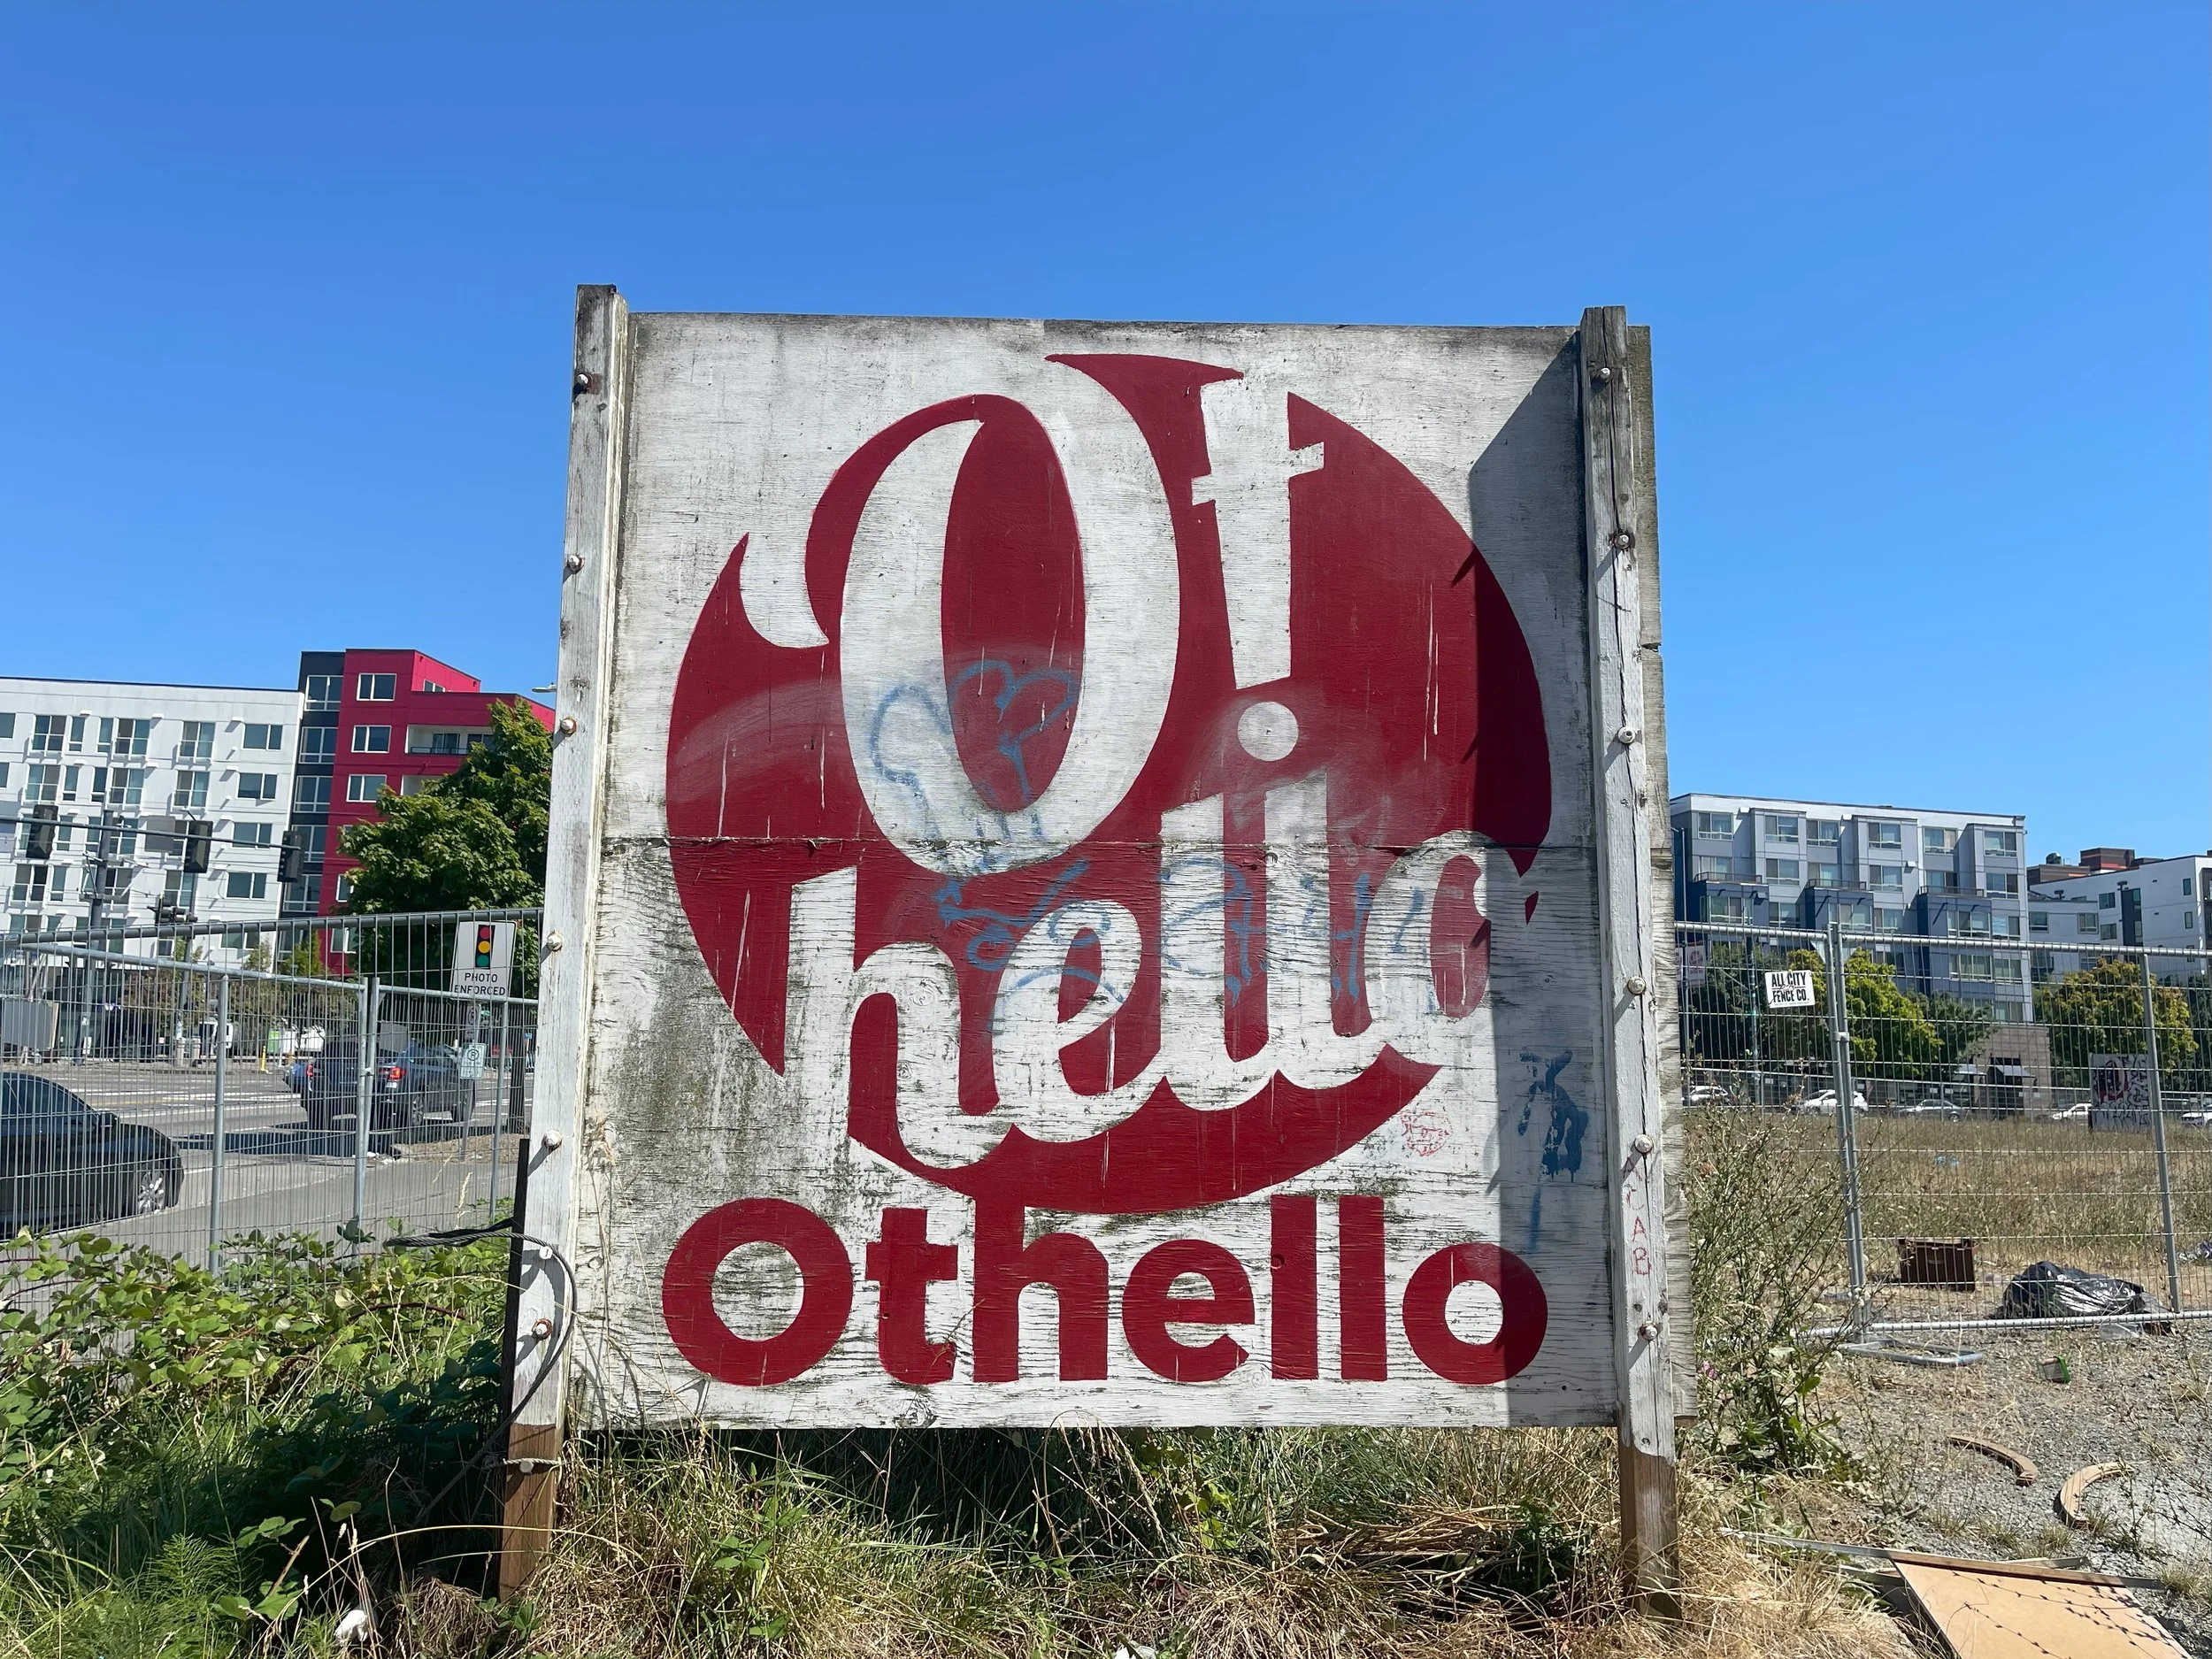
OTHELLO
Othello is a 2.15 sq mile neighborhood located in SE Seattle. 82.1% of its population identifies as BIPOC (Black, Indigenous, and People of Color) in contrast to Seattle’s overall BIPOC population of 37.8%. This makes the neighborhood lead with the highest percentage of BIPOC residents compared to all other neighborhoods in the city. (Source: City of Seattle’s: Department of Neighborhoods)
This location was chosen based off of the prioritization of communities that have been historically underserved and past Slow the Flock Down outreach efforts by the Seattle Department of Transportation.
19,356
Total Population
2,820
Aging - 65+ years old
2,362
Disabled
3,979
Youth - Under 18 years old
Source: 2021 5-year American Community Survey (ACS) estimates
OUTREACH & ENGAGEMENT
Our engagement approach used a combination of both a physical and virtual presence to capture the voices of the Othello community. From August - September we did the following:
Visited + provided survey flyers to small owned businesses.
Flyered: street poles on main streets, message boards, and one Seattle Housing Authority Event
On 8/30/2023 we held a pop-up table event with an SDOT representative on the corner of Martin Luther King Jr. Way S. & S. Othello St.
THE SURVEY
Flyers that were handed out contained a QR code which when enabled would lead to an online interactive survey seen below. From 8/30/2023-9/15/2023 a total of 18 participants took the survey.
SURVEY RESULTS
The survey provided 5-questions that helped guide community members with providing their voice in identifying problematic areas within their neighborhood and along with gaining knowledge of the program.
The majority of respondents have heard of the Slow the Flock Down campaign.
Respondents are well adapted to taking multimodal transportation options.
Over half of the respondents identified dangerous speeding and crash areas via the place a pin on the map slides.
63%
Have heard of the Slow the Flock Down Campaign

Speeding areas identified by the community
Includes pop-up table event feedback

Dangerous crash areas identified by the community
Includes pop-up table event feedback
Is there anything that would help you feel safer walking, rolling, biking, busing, light rail'n on Seattle streets and public places?
-
"39th would be much safer as a one-way street with 1 side parking. My car was hit and nearly totaled while parked on 39th. When we ask drivers to slow we are harassed. It is not a suitable arterial."
-
"Better curbs & crosswalk infrastructure"
-
"No free right hand turn at the intersection of Othello and MLK"
-
"Speed bumps"
-
"Speed pump on the 39th S Ave and S Holly Park dr"
-
"A series of speed bumps along 39th in the New Holly area from Othello to Kenyon. We have had a lot of dangerous and reckless drivers speeding on our block"
OTHELLO’S STREETS
The maps shown below display various crash statistics for Othello.
Crash data 2004-2023 (Source: SDOT)
Arterial data (Source: SDOT)
6,441
Total crashes

20
Total fatalities

272
Total crashes that involved speeding
15,968
The total amount of people involved in a crash
AREAS OF OPPORTUNITY
FOR COMMUNITY, BY THE COMMUNITY
The maps below shows the areas with the most dangerous speeding zones and the most perilous crash sites as recognized by community members. These areas of opportunity are overlapped with past and current crash data for a more refined boundary that is meant to be used as a starting point for implementing safety improvements by SDOT.
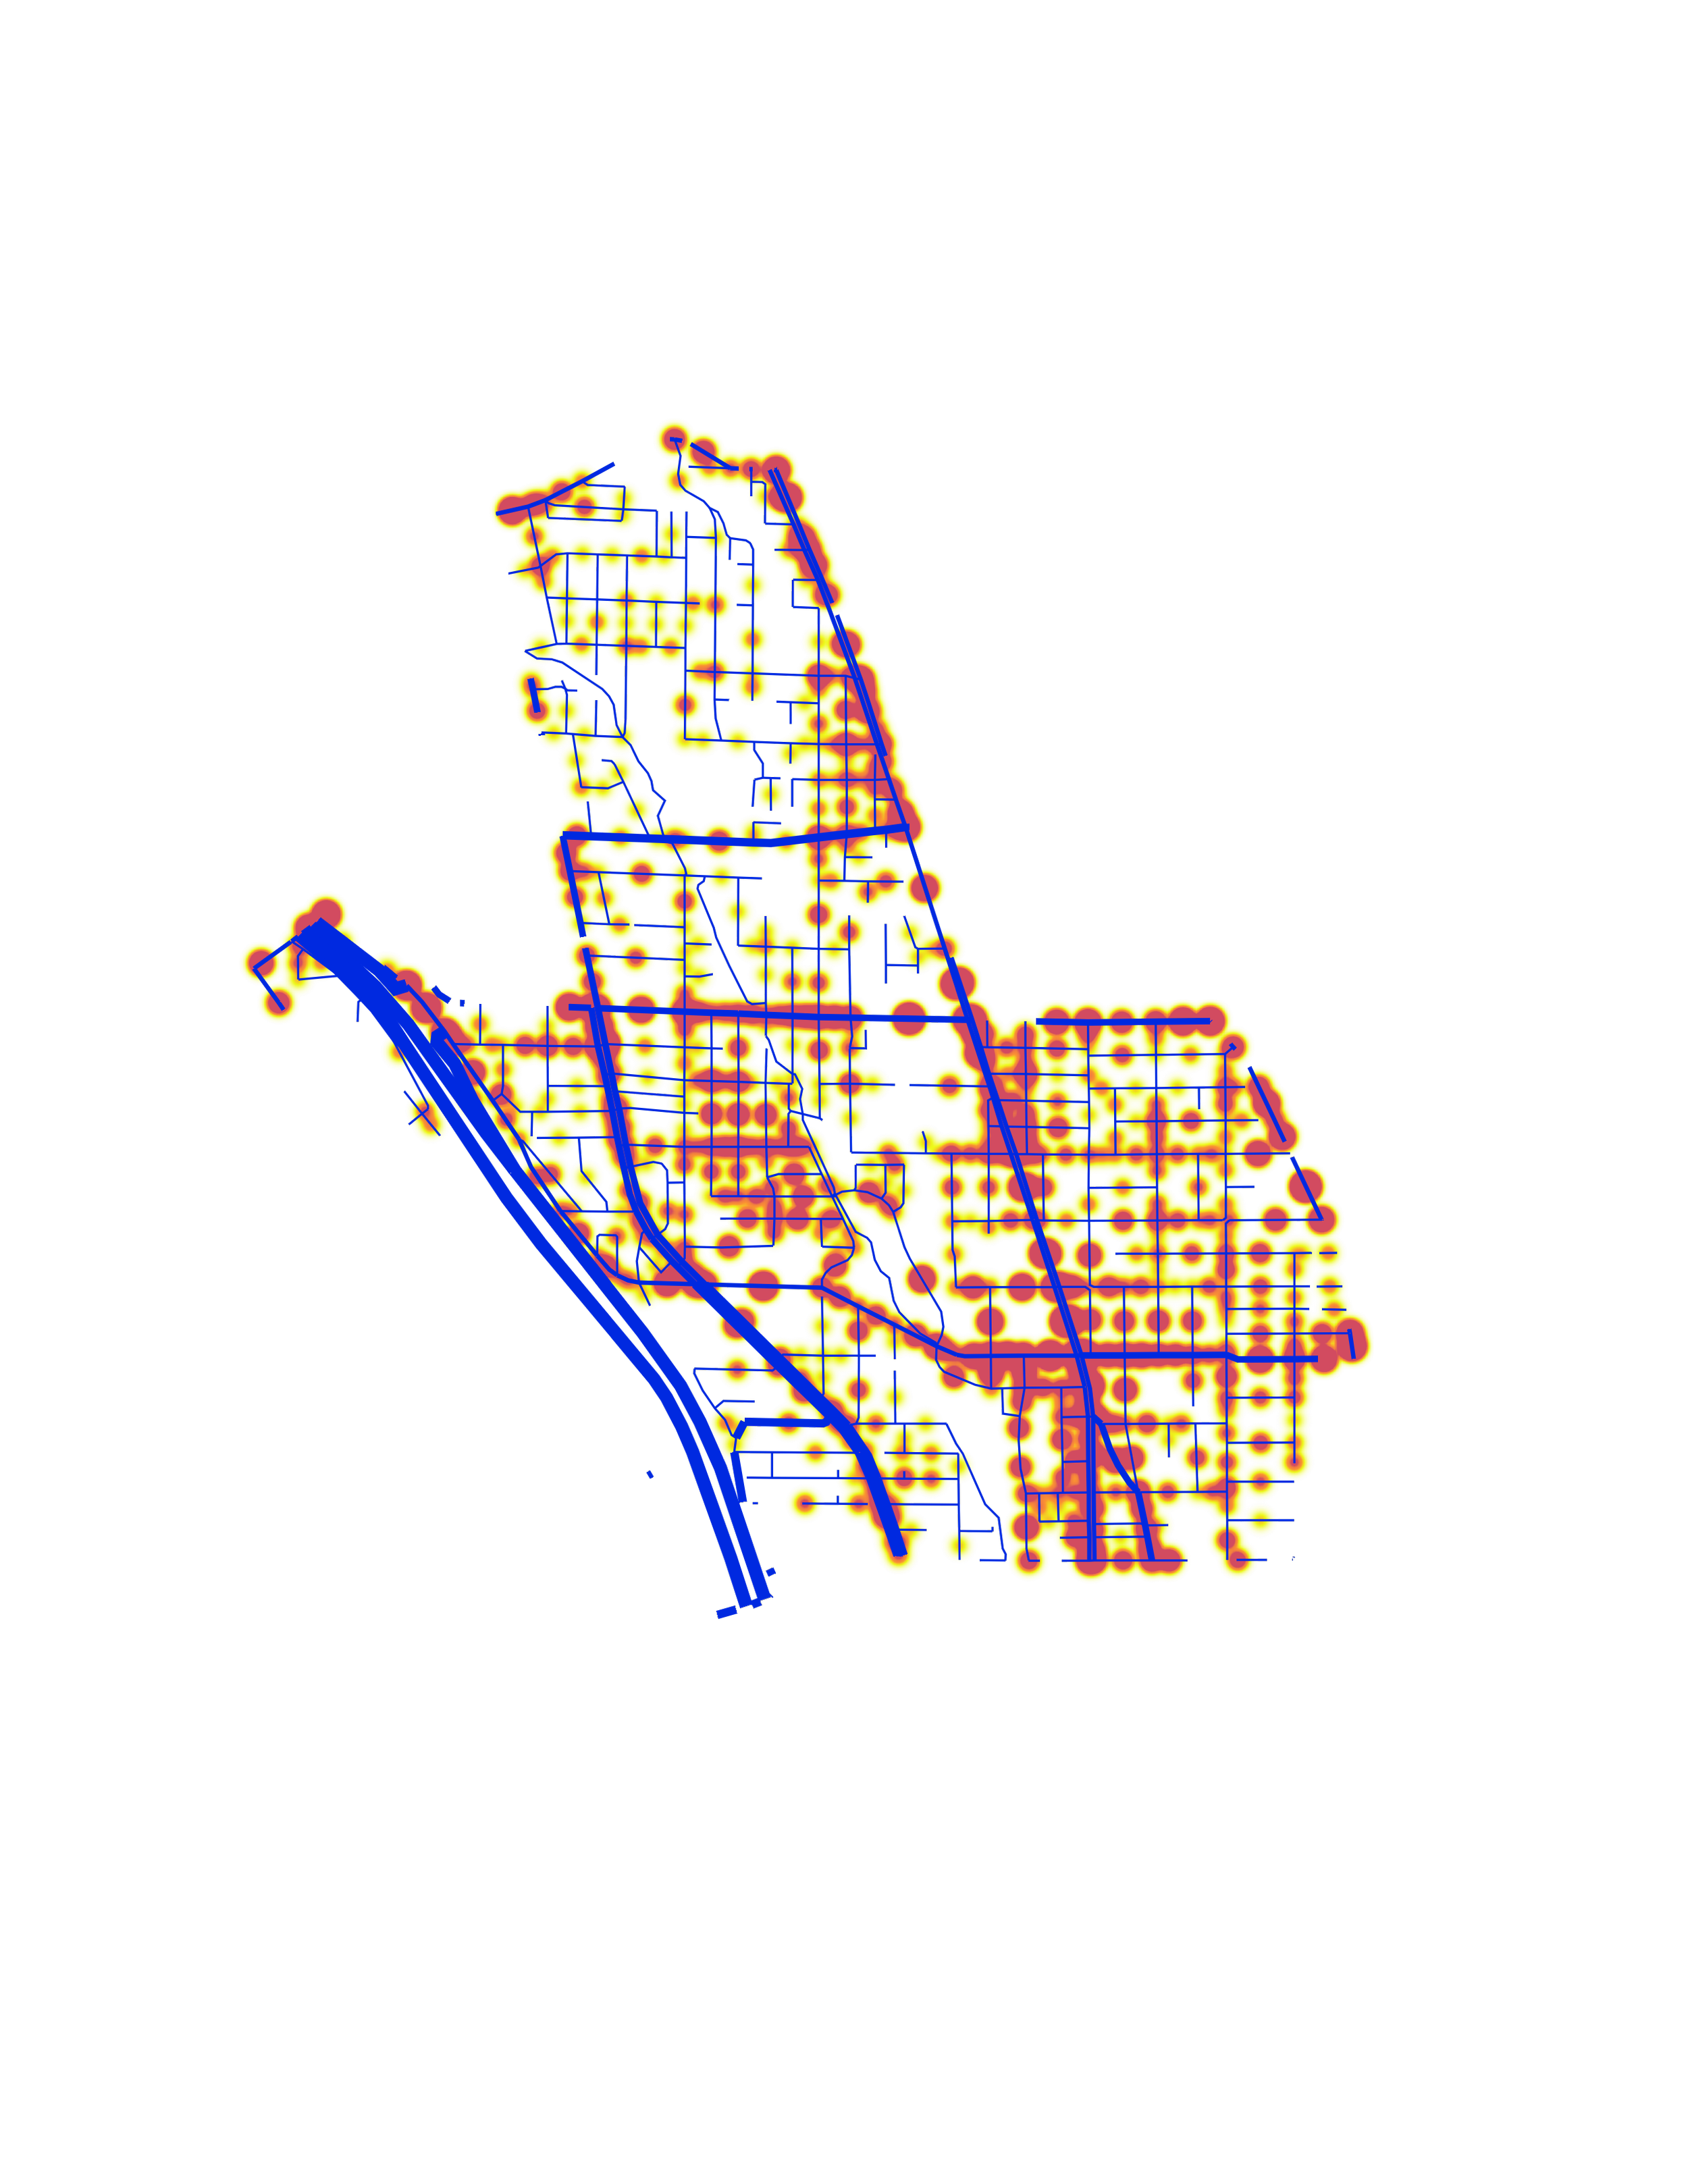
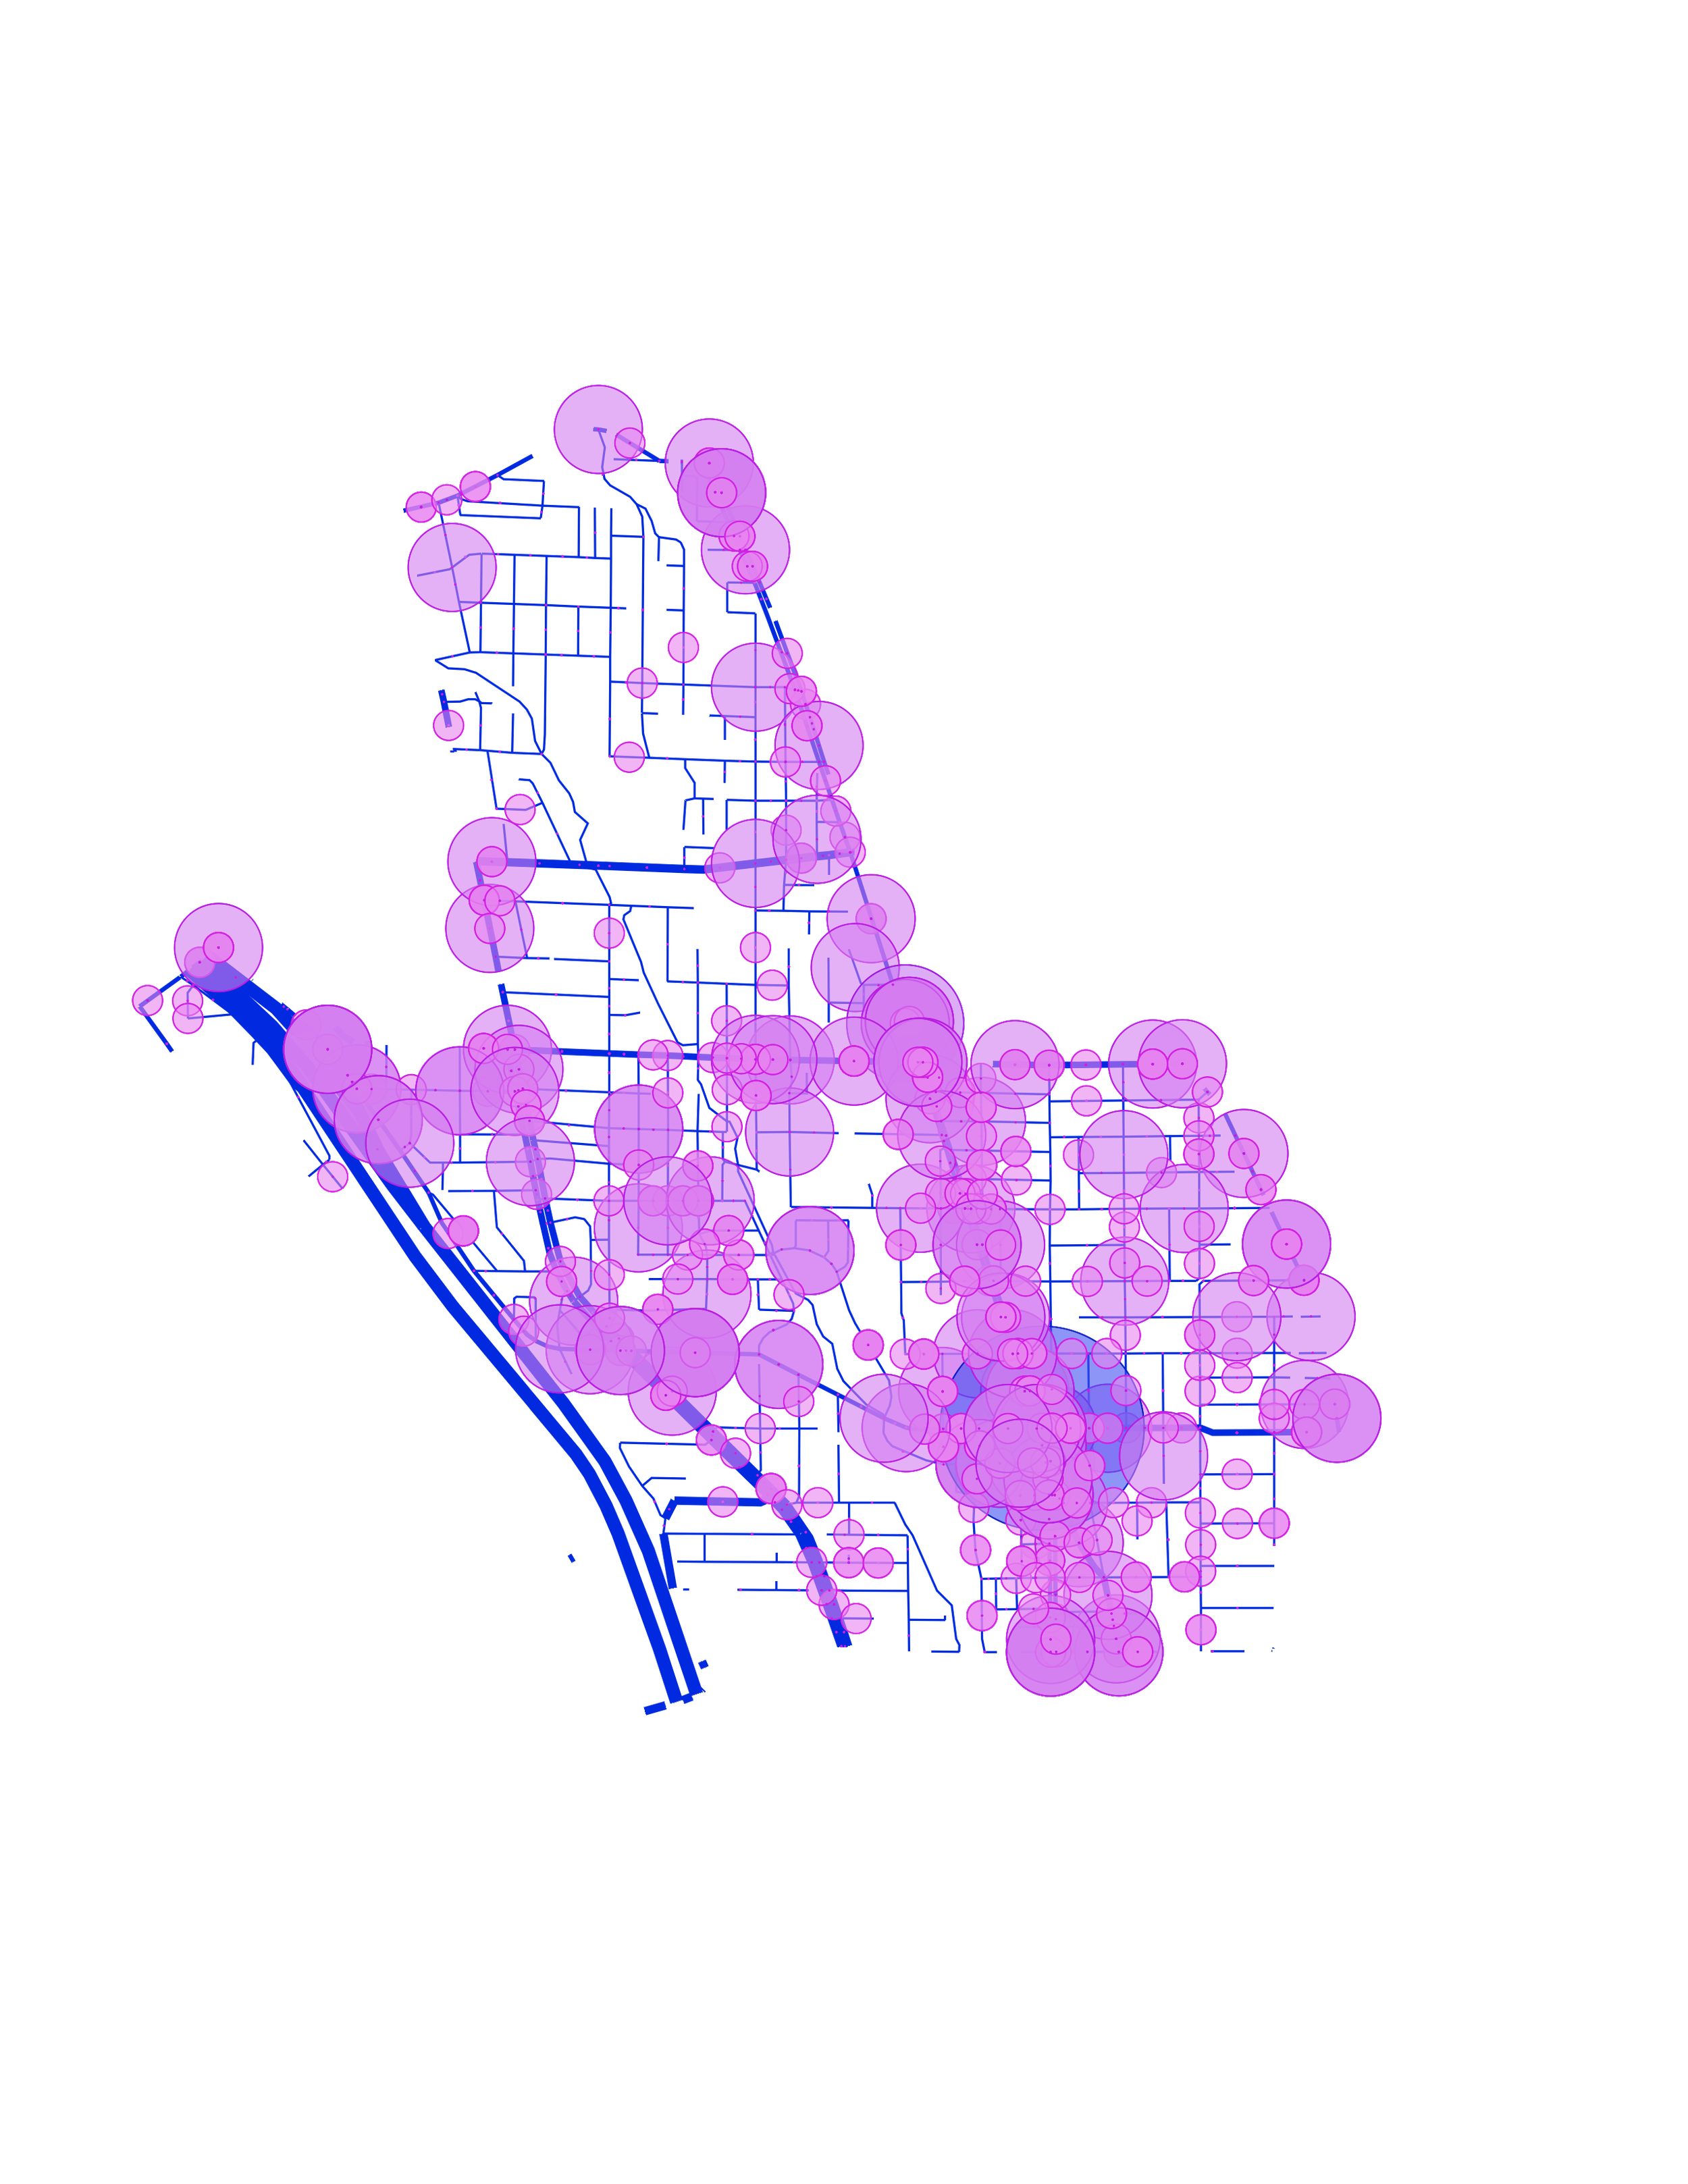
Othello’s Most Dangerous Speeding Areas: Identified by community
This map displays the density of all speeding crashes found within a 1/4 mile walking distance of speed comments gathered by the community.

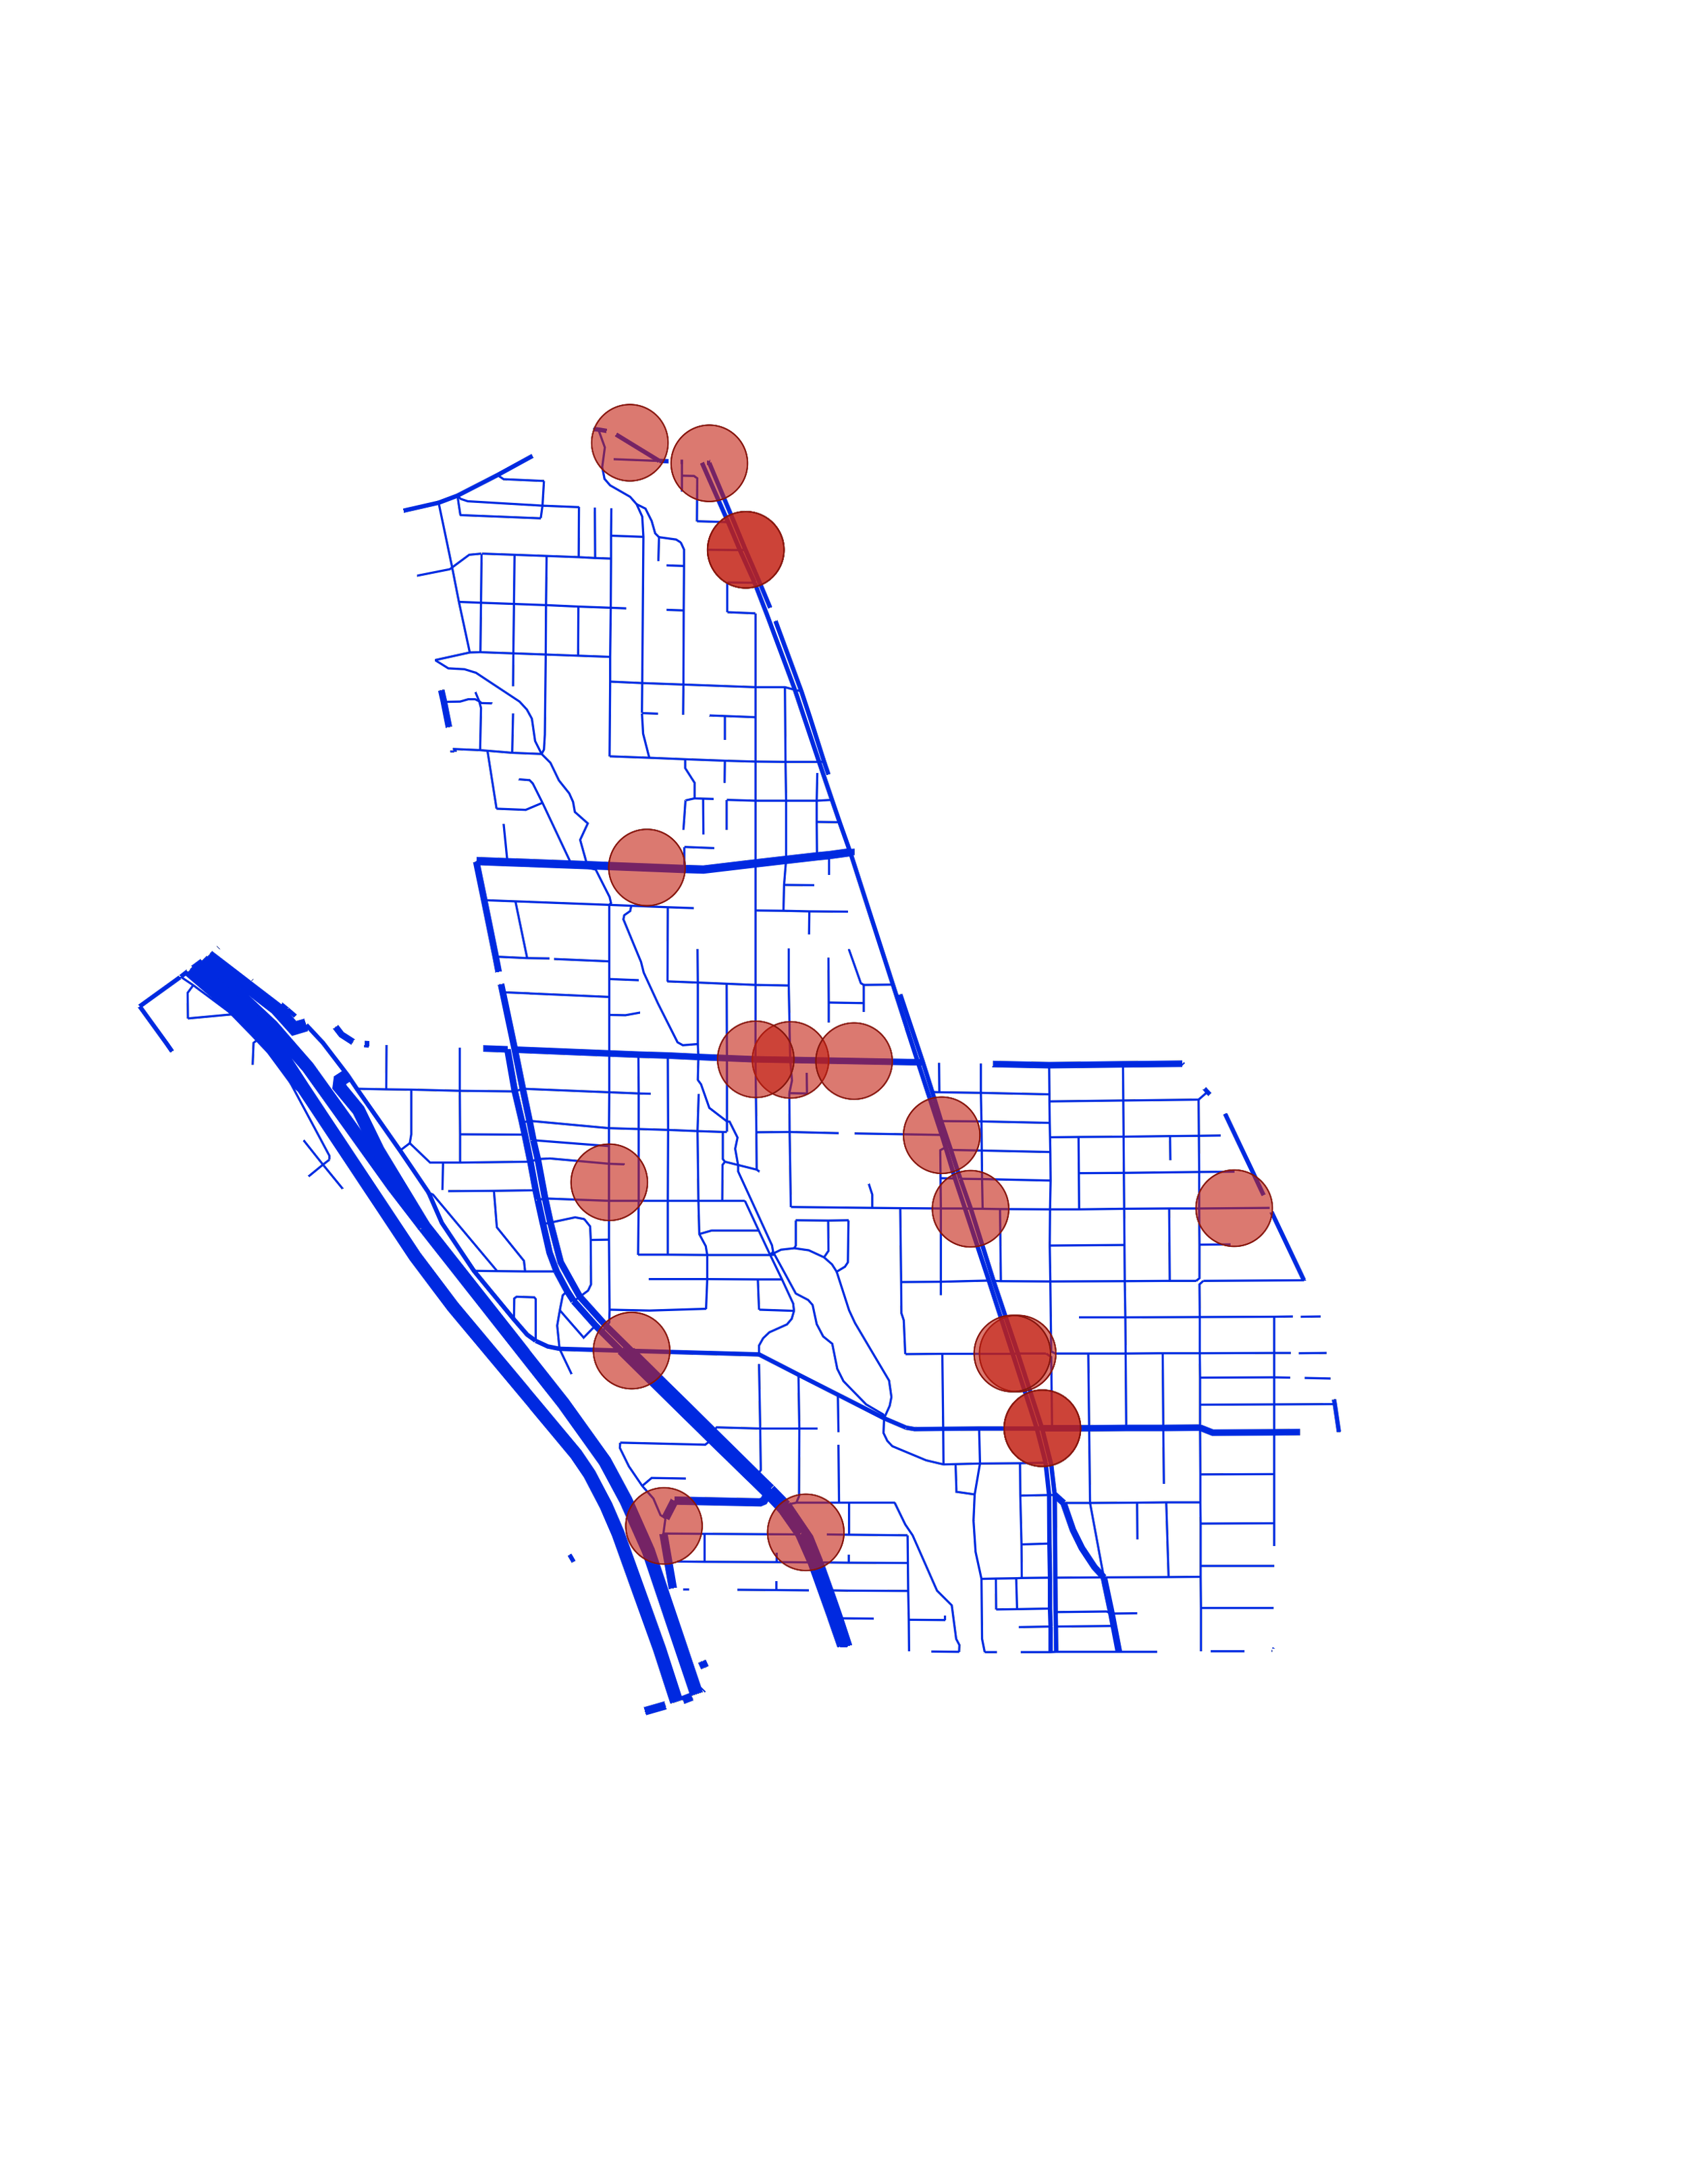
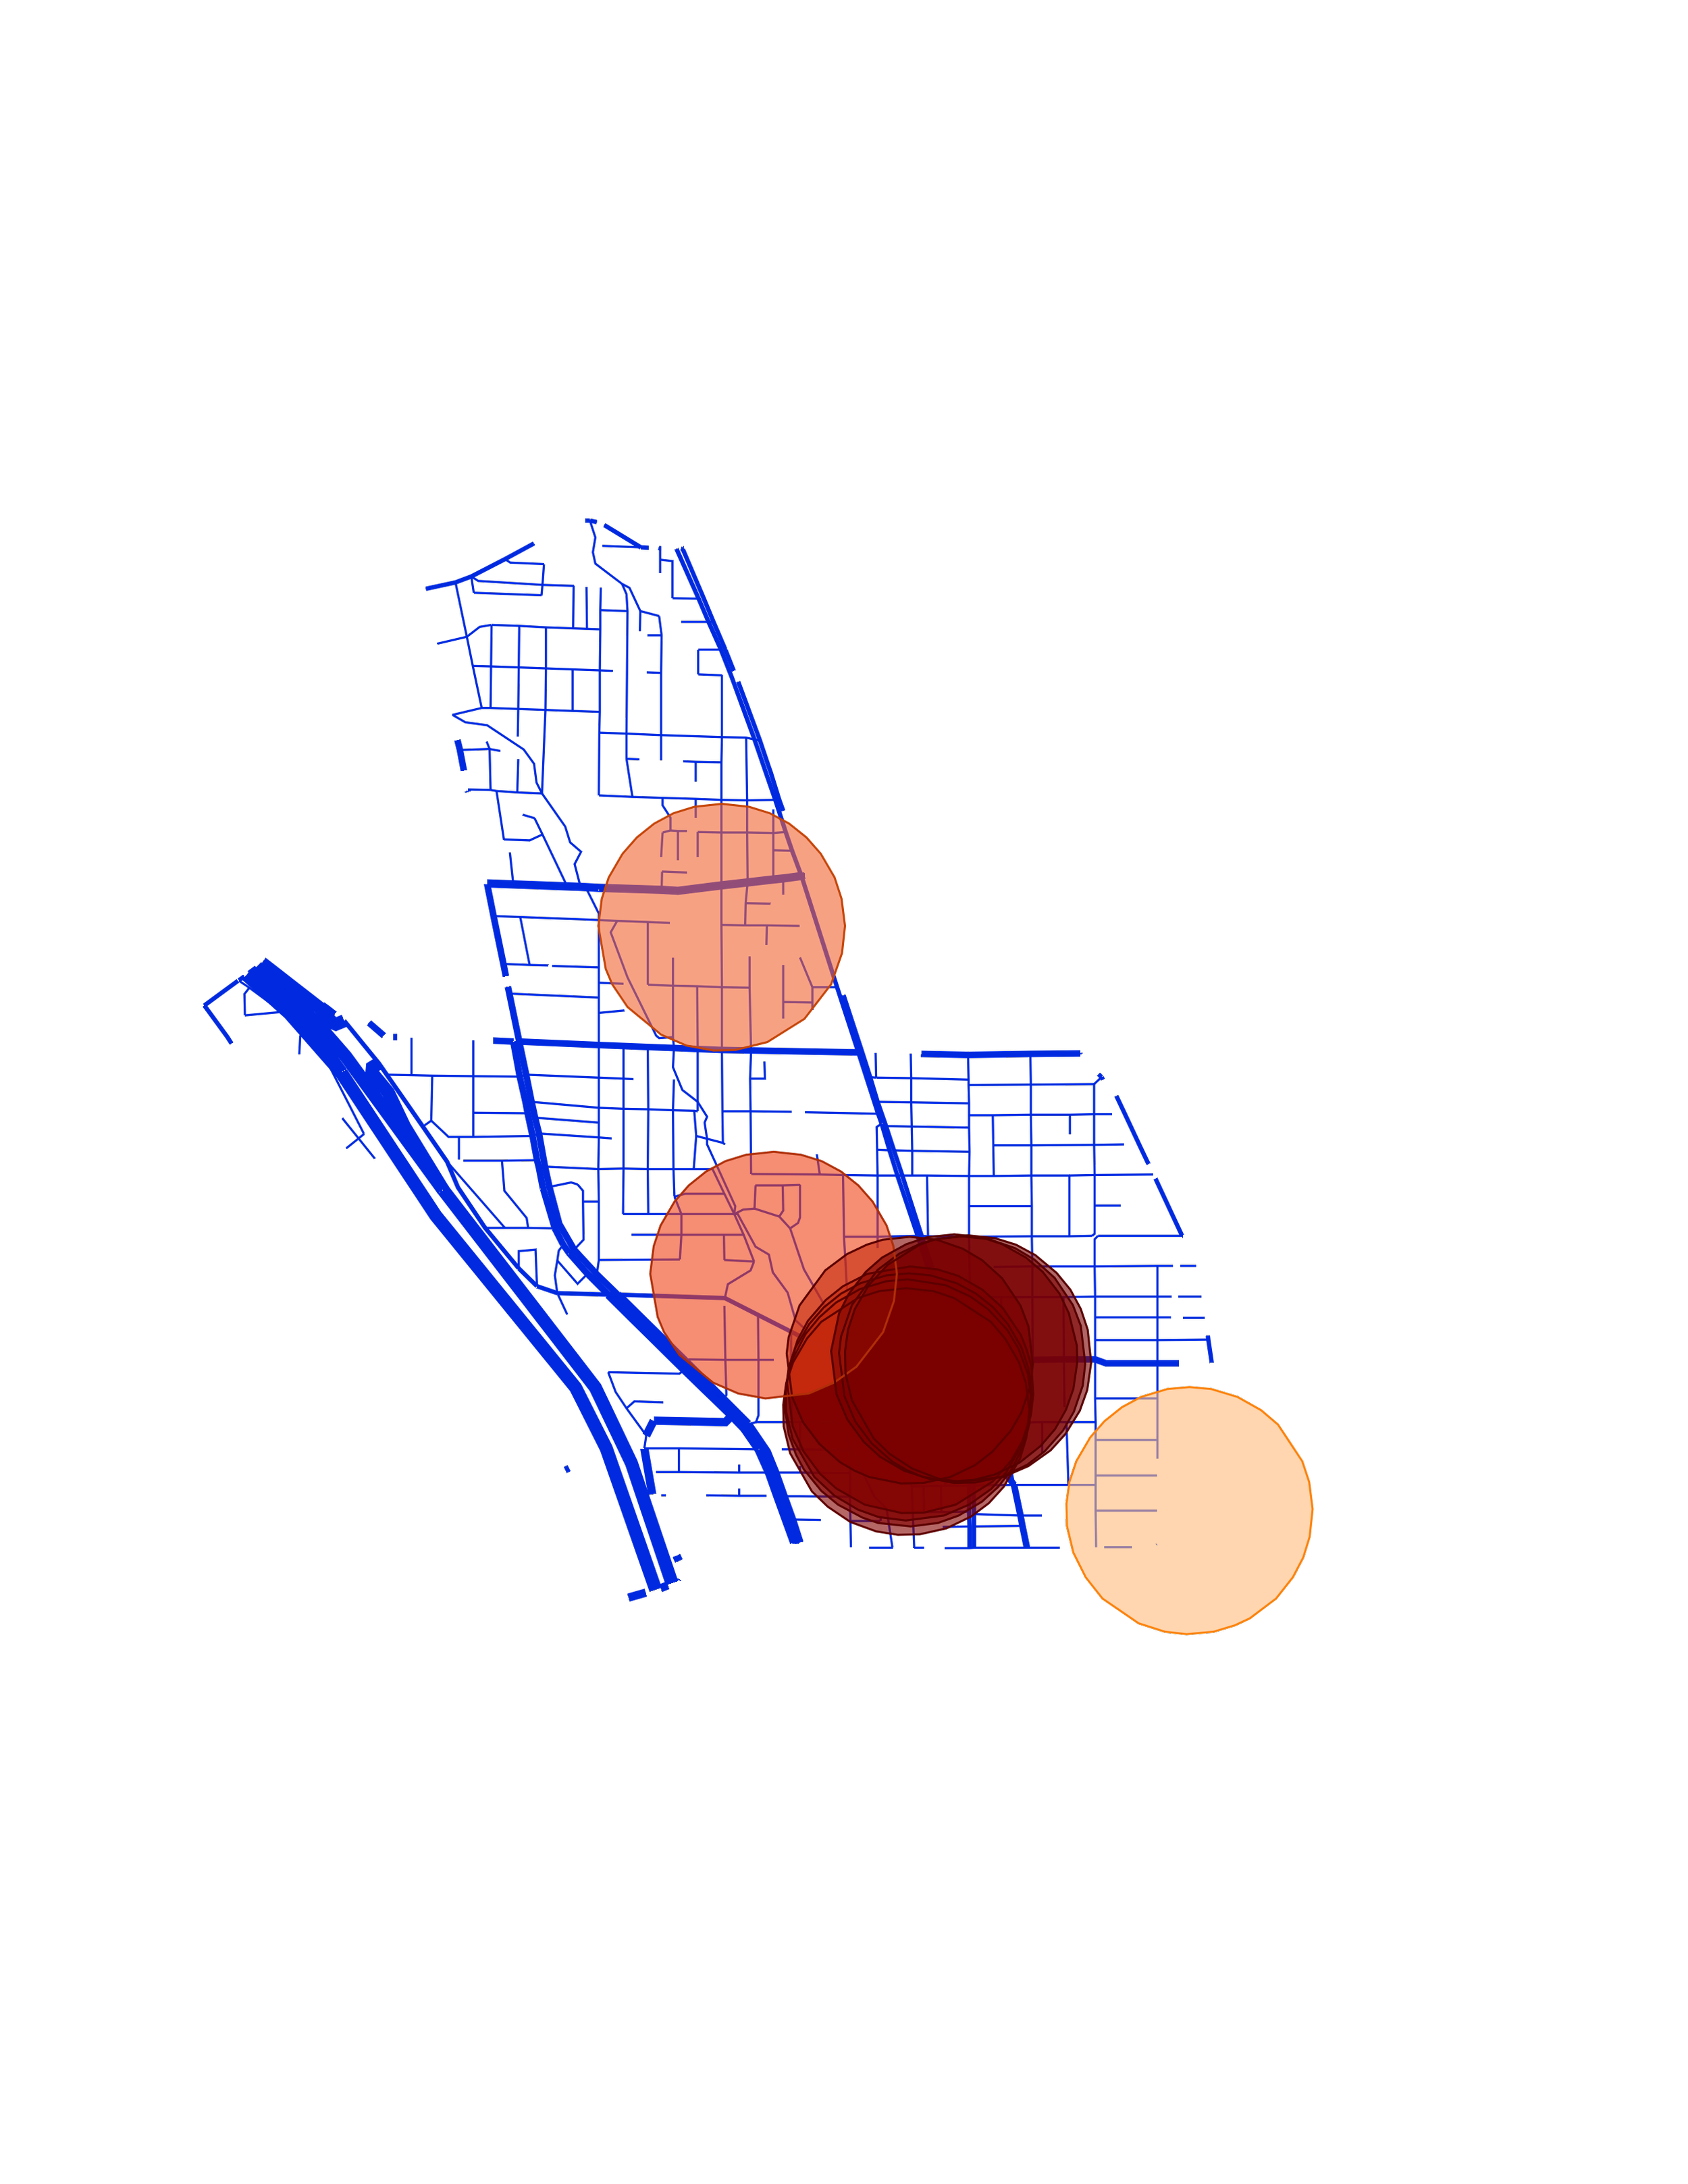
Othello’s Most Dangerous Crash Areas: Identified by community
This map displays the density of all crashes found within a 1/4 mile walking distance of crash comments gathered by the community.
RECOMMENDATIONS
We know that the neighborhood itself has experienced a total of 6,441 crashes, which has impacted 15,968 people to date. That’s equivalent to 82.5% of its total population.
We know Othello leads with the highest percentage of BIPOC residents compared to all other neighborhoods in the city. (Source: City of Seattle’s: Department of Neighborhoods)
We know that BIPOC people have had our mobility arrested while walking, driving, biking, etc. (Source: Arrested Mobility)
We recommend using alternatives for police enforcement for mitigating crashes through the use of sustainable, innovative, and inclusive street design solutions. Building off of current AI testing efforts is a great start. (Source: KUOW)
We know that Othello has a major arterials that visibly show the highest amount of crashes (MLK Jr. Way & S. Myrtle St.). The design of the streets provide drivers with the perception/ability to speed.
We recommend identifying future ordinances that do not align with #VisionZero. Ordinances like Res 32097 which includes reductions in curb cuts. This contradicts #VisionZero street designs that demonstrate the reduction of fatal and serious crashes.